RSS

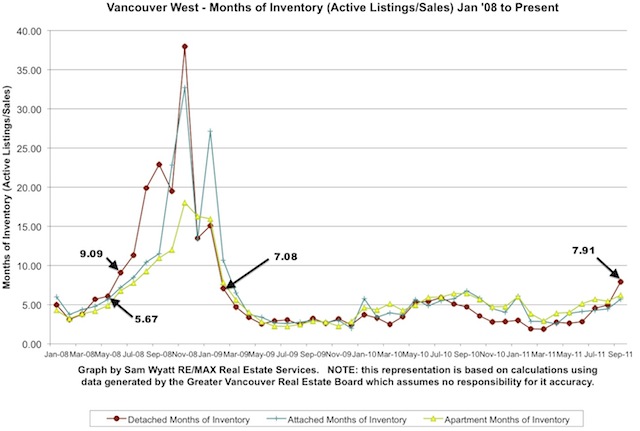
Last month the Months of Inventory (MOI) for detached homes on the Westside of Vancouver jumped from 4.95 months in August to 7.91 for the month of September.  October's Detached MOI has now dropped to 6.89 allaying fears that the market was about to see a steep fall.  Months of Inventory also fell for Apartments from 6.21 to 5.7 but Attached homes saw the metric rise from 5.69 to 6.4.  Average monthly sale prices fell marginally across all market types in October.

The Months of Inventory numbers have by and large decreased since last month but they are still relatively high compared to the preceding 12 months.  One should expect to see a subdued market over the next few months with stable to falling prices.

The larger context for Vancouver's real estate market is the slow motion sovereign debt crisis that continues to unfold in Europe and the prospect of global recession.  To what extent this will affect money from abroad, particularly China, from continuing to feed Vancouver's market is unknown but one could reasonably assume a mitigating effect.

Remember that Months of Inventory” (MOI) is a measure derived from the number of active listings during a given month divided by the number of sales that month. It indicates the theoretical length of time it would take to sell all of the properties on the market if nothing changed. Historically, 0-5 months of inventory has generally implied upward price pressure for the ensuing six months, 5-8 months of inventory meant a flat market with respect to pricing and over 8 months of inventory has, for the most part, precipitated downward price pressure.

Do not hesitate to call me if you have any questions and please pass this and my contact information along to any friends or family who might benefit from my services.

- Sam Wyatt - Vancouver Realtor
Oct - Months of Inventory
Oct Avg Prices

Read

“Months of Inventory” (MOI) is a measure derived from the number of active listings during a given month divided by the number of sales that month. It indicates the theoretical length of time it would take to sell all of the properties on the market if nothing changed. Historically, 0-5 months of inventory has generally implied upward price pressure for the ensuing six months, 5-8 months of inventory meant a flat market with respect to pricing and over 8 months of inventory has, for the most part, precipitated downward price pressure.

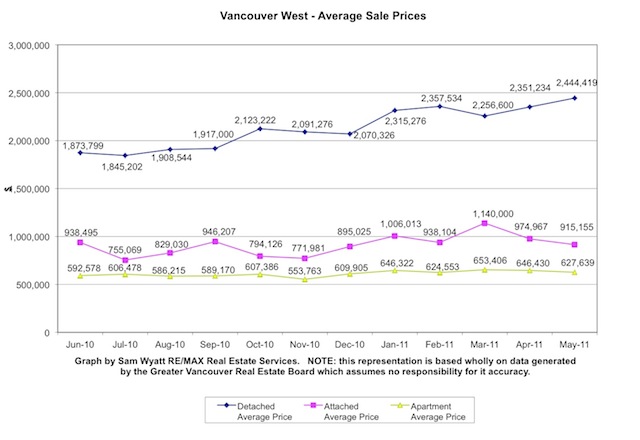
The Months of Inventory for detached homes on the Westside of Vancouver jumped from 4.95 months in August to 7.91 for the month of September.  The MOI has not been this high since February 2009 when the market was just recovering from the 2008 credit crisis.  From June 2008 through February 2009 the MOI for Westside detached homes was over 8 months and at the high point it nearly hit 40 months.  Average prices dropped from their 2008 pre-crisis high of $1,858,267 to $1,294,341 in February 2009 - about a 30% drop.  Lower pricing and record low interest rates fueled a surge in first time buyers entering the market in 2009.  By 2010 a wave of Chinese buying in the Westside detached market buoyed up the average price to its current high point of $2,499,927 in June 2011. 

About a year ago inventory numbers for all markets were trending up and I said then that I expected the market to fall.  I was wrong.  The huge influx of Chinese buyers drove down detached inventories and drove up prices.  I believe that I was premature in my projection.  Looking at the MOI numbers now, they are in worse shape then last year and the global market news is bad - nearly as bad as 2008 and some would argue worse.  A new market drop could conceivably put pricing back as low as the February 2009 numbers.

I would not bet against these numbers and economic news.  If you have been thinking of selling don't wait a day to call me.  For those of you who have just sold property - well done.  For those who are looking to buy - the market may finally be with you.

Do not hesitate to call me if you have any questions and please pass this and my contact information along to any friends or family who might benefit from my services.

SAM WYATT - Vancouver Realtor
Sept 2011 MOISept 2011 AVG Prices

Read

The big question I've been getting lately has been what effect will the rescission of the HST have on the price of new condos in the Vancouver real estate market.  I'm no economist but my take is that, in theory, it should have no effect.  The change in tax should have no effect on new construction pricing because real estate is a very price elastic commodity and buyers will only pay what they are willing to pay.  In other words, tax or no tax, the market will pay exactly what it is willing to and this amount is the total cost including all taxes and services needed to buy the asset.
It can then be argued that the HST decreased the total revenue that a developer could receive for selling a new home and thus shrunk their margins.  On the other side, developers will have increased construction costs once the tax is gone because they won't be able to claim input tax credits on what was the provincial portion of the HST.  I suspect that even if these costs and benefits don't balance out, their effect should not be significant.  In fact, due to the nature of how the City of Vancouver negotiates Community Amenity Contributions (CAC) for re-zoning applications they may have an even smaller effect.  When a developer of a large development applies to re-zone a piece of land, the City of Vancouver takes the approach that the change in zoning to allow more density is a value in the land that belongs to the City.  The developer and the City negotiate to determine what the profit margin on the project is forecast to be and after allowing for a developer's reasonable profit (about 15-20%) the remaining margin is paid to the City as "CAC's" in the form of new parks, community amenities or cash.  Any change in the overall margin might then be the City of Vancouver's.
For large projects, it is my suspicion that the elimination of the HST will have only a small effect on developers' forecast margins so I would anticipate most new developments to proceed irrespective of the HST change.

The real probable result of both the implementation and the rescission of the HST on pricing for new construction is its effect on the psyches of buyers.  Buyers may think now that if they wait till 2013, the HST will no longer apply and they will pay less for their new home.

They may well pay less, not because they don't have to pay HST but rather, because of the slumping sales as a result of everyone holding off buying.

Do not hesitate to call me if you have any questions and please pass this and my contact information along to any friends or family who might benefit from my services.

SAM WYATT - VANCOUVER REALTOR

Chart - Inventory.jpgChart - Avg Prices .jpg

Read

The months of inventory index for Westside apartments upwardly breached 4 Months of Inventory (MOV).  This resulted from both fewer sales and more new listings coming on to the market.  The attached MOV reached 3.9 and detached homes sit at 2.63.  The month of May gave us a chance to breathe as ultra low inventories in the detached market eased with more homes being listed.  May marks the fifth consecutive month that the number of active listings rose for detached homes.  There were 599 detached Westside homes for sale in May.  In spite of the increased inventory the average price of a detached home rose to over $2.4m - yet another all time high!

We are experiencing a "Top Down" market where upward price pressure is being created from demand for the most expensive real estate.  Buyers who were looking to buy a detached home might have been priced out of that market and chose to buy a 1/2 duplex; buyers who wanted a 1/2 duplex may have been forced into buying a townhome, townhome buyers into a 3 bedroom apartment - all the way down to a first time studio buyer who decided that they would rent or move to a different market.  Because the supply is much greater at the bottom of the market (studios and 1 bedroom apartments), it is seeing the lowest price increases and lower relative demand.  I speculate that when this market begins to fall it will be the apartment market that suffers first.

A recent BC Business article claims that 2 houses are being demolished each day in Vancouver.  Some of these are being built as new detached homes but most of them are becoming multi-family dwellings.  This means that every day there are fewer and fewer detached homes in Vancouver West with more and more people who want them.  Similarly, every day there are more and more apartments and attached homes with relatively fewer interested buyers.

It remains to be seen how long the Chinese buying influence will continue in Vancouver and if the glut of new apartment building will be sustainable.  It is certainly a good time to sell but the apartment and detached market may have a more limited horizon.


Remember that: “Months of Inventory” is a measure derived from the number of active listings during a given month divided by the number of sales that month. It indicates the theoretical length of time it would take to sell all of the properties on the market if nothing changed. Historically, 0-5 months of inventory has generally implied upward price pressure for the ensuing six months, 5-8 months of inventory meant a flat market with respect to pricing and over 8 months of inventory has, for the most part, precipitated downward price pressure.
Do not hesitate to call me if you have any questions and please pass this and my contact information along to any friends or family that may benefit from my services.

- SAM WYATT, Vancouver Realtor

11-Vancouver West Month of Inventory-May.jpg11-Vancouver West AVG Sale Prices-May.jpg

Read

Vindication! After starting a letter campaign last year, talking to the Strata compliance officer and receiving a phone call from the Real Estate Council VP, the RECBC admits that they have no authority to restrict Strata Lot owners from posting or instructing their Realtor to post Strata minutes online! (see Report from Council Dec 2010. p3) In an about face move, the council sheepishly and opaquely confirmed that a standard signed listing contract gives a trading licensee - the right to post documents online for that property.  The report infers, correctly, that the ONLY body with the right to restrict how an owner distributes Strata minutes is an individual Strata Corporation and even then, only within the limits of the Strata Act.  Gotta keep an eye on those regulators who think they can invent legislation on the side. - By Vancouver Realtor, Sam Wyatt

Read

How quickly the tides have turned from the middle of 2010.  In spring of 2010 the Months of Inventory metric trended up to about 6 months of inventory.  Now the months of inventory index for Westside detached homes, after falling four consecutive months in a row, remaines at under 3 months of inventory as of December 31st.  The average sale price of a detached house on the Westside remained over $2 million dollars for a third consecutive month and was over 2 million for 6 months of 2010.  The attached and apartment months of inventory numbers respectively fell for the 2nd and 3rd months in a row and both of them are reside below 5 months of inventory.  Prices have ebbed and flowed in these two catagories but over the year they have remained relatively stable.
Low mortgage rates and money from China have spurred on the market thus far.  The Canadian Government reduced the maximum amortization from 35 to 30 years and maximum financing limit from 90% to 85% on insured mortgages.  These measures won't likely change much but they do indicate that the Governement (and likely the Bank of Canada too) is concerned about the size of mortgage debt at a time when everyone expects interest rates to continue to rise.  When buying property in this environment, take a conservative view of costs and think about your risk tolerance.  Definitely speak to a mortgage broker and get good professional advice.  As for sellers, I continue to implore people holding properties that they want to sell anytime in the next 5 years to sell NOW while money is cheap and the market is high.  

Remember that: “Months of Inventory” is a measure derived from the number of active listings during a given month divided by the number of sales that month. It indicates the theoretical length of time it would take to sell all of the properties on the market if nothing changed. Historically, 0-5 months of inventory has generally implied upward price pressure for the ensuing six months, 5-8 months of inventory meant a flat market with respect to pricing and over 8 months of inventory has, for the most part, precipitated downward price pressure.
10-Vancouver West Months of Inventory-Dec.jpg
10-Vancouver West AVG Sale Prices-Dec.jpg
By Vancouver Realtor - Sam Wyatt
Read

You can't argue with the numbers (much as I would like to).  The months of inventory index for Westside detached homes has fallen four consecutive months in a row; in November to under 3 months.  The average sale price of a detached house on the Westside remained over $2 million dollars in November.  If months of inventory stay like this, we can expect these strong sales prices to continue for a little while to come.  The attached and apartment months of inventory numbers fell for the 2 month in a row and both of them are sitting below 5 months of inventory.  Prices have ebbed and flowed in these two catagories but over the year they have remained relatively stable with a downward tendency in the last several months.
The inventory and sale price numbers for detached homes continue to surprise, so I have dug a little deeper into the details.  Nearly half of all the detached Westside homes that sold over the $2,091,276 average price were sold in Shaughnessy or South Granville, most of the remainder being found in surrounding Quilchena, Kerrisdale, Mackenzie Heights, Dunbar and also in Point GreyAn interesting note is that the vast majority of these homes sold to Chinese buyers.  Only a couple of the homes that sold over the average were in Kitsilano and none of the homes were in Fairview.  Only one home was sold over the average east of Cambie Street.  This tells us a few things we already know:  one, Shaughnessy is an expensive neighbourhood and two, that Chinese immigration is having a significant impact on home prices in Vancouver.  It also tells us something interesting:  that homes in Kitsilano, Fairview, Cambie, Oakridge and Mount Pleasant remain, in relative terms, affordable.

Click on this link for an interesting read about Chinese immigration and the Vancouver Real Estate Market:

Globe and Mail Article

It appears that the market is refusing to follow its year long trend of increasing months of inventory and is instead defiantly hanging on - for now.
If you are holding investment property, I would highly recommend taking advantage of the present situation to sell it at peak pricing.  If you are shopping for a Westside home, your best bang for your buck is in Kits, Fairview and and east of Cambie Street.


Remember that: “Months of Inventory” is a measure derived from the number of active listings during a given month divided by the number of sales that month. It indicates the theoretical length of time it would take to sell all of the properties on the market if nothing changed. Historically, 0-5 months of inventory has generally implied upward price pressure for the ensuing six months, 5-8 months of inventory meant a flat market with respect to pricing and over 8 months of inventory has, for the most part, precipitated downward price pressure.
 

Do not hesitate to call me if you have any questions and please pass this and my contact information along to any friends or family that may benefit from my services.
Average Price Nov 2010
Months of Inventory - Nov 2010
By Sam Wyatt - Vancouver Realtor

Read


“We’ve seen a lot more consistency and less volatility in recent months when it comes to both number of sales and pricing, although it’s important to remember that conditions often vary between communities and neighbourhoods,” - Jake Moldowan, Real Estate Board of Greater Vancouver (REBGV) president.

Well Jake can say that again - at least the second part.  The Vancouver West average detached home sale price in October was the highest ever at $2,123,222.  Wow.  As mentioned in last month's report, the Westside detached market was the anomaly.  Its months of inventory index fell again, this time to below 4 months indicating that upward price pressure can be anticipated.  Months of Inventory was down for apartments and attached homes as well but in a less significant way.
So what is going on?
One explanation for the detached market's performance might be fixed mortgage rates.  Five year fixed rates in October were the lowest they have ever been and this is likely more significant for detached homes.  Ironically, the high cost and thus the high mortgage values of detached homes means that low fixed term rates may encourage riskier purchases.  We have had extremely low variable rates of late but as an example let's look at a $2m purchase with a $1m mortgage.  The risk of a rising interest rate might make this kind of purchase unsettling, seeing as a rise of 2% could add more than $1000/month to the payments.  The same $1m mortgage with a fixed interest rate of 3.29% makes the decision much easier - with the certainty that rates won't go up, the purchaser can rest easy.  Another explanation could be the continuing influx of Chinese and other foreign money into the Westside market.  British Columbia has one of the most attractive 'investor' immigration programs in Canada.  For as little as a $200k of investment, an investor can immigrate to British Columbia.  With such a low barrier, it is no wonder that the money is flowing and it is flowing to neighbourhoods with so called "top ranked" schools (i.e.: Fraser Institute - whose school rankings I put little stock in).  In other words Vancouver West.  Vancouver may also have developed a "safe haven" reputation in an otherwise difficult global real estate market.  The high prices may actually be creating a positive feedback cycle.
So what does it all mean to me?
I would say that it is wise not to get carried away.  I do not believe that this is a wholesale reversal of an otherwise strong trend downwards.  It does mean that those of you who are  selling your detached homes might get a little more of a frothy top to the market and pocket some extra capital.  The prospect for attached and apartment markets are less rosy - they are likely going to continue to trend down.  Ultimately, I also expect the detached market to re-couple and return to a downward trend.
 
   Remember that: “Months of Inventory” is a measure derived from the number of active listings during a given month divided by the number of sales that month. It indicates the theoretical length of time it would take to sell all of the properties on the market if nothing changed. Historically, 0-5 months of inventory has generally implied upward price pressure for the ensuing six months, 5-8 months of inventory meant a flat market with respect to pricing and over 8 months of inventory has, for the most part, precipitated downward price pressure.
 
Do not hesitate to call me if you have any questions and please pass this and my contact information along to any friends or family that may benefit from my services.


Sam Wyatt - Vancouver Realtor
10-Oct-Average Prices10-Oct-Months of Inventory

Read

Slow deterioration would be my description of the present Vancouver real estate market.  Vancouver West's September listing volumes rose and sales volumes for both dropped yet again, edging the Apartments and Attached homes Months of Inventory metric closer to 7 months.  The anomaly has been the Detached market where September became the second month running where active listings declined and sales volumes increased.  The trend is still clear:  the over all year to date months of inventory has more than doubled for the Vancouver West residential market and is likely to continue.
 
For sellers, the good news is that although the market is in decline, it is doing so very slowly.  Unlike the 2008 credit liquidity crises (started by sub-prime mortgage backed collateralized debt obligations), there has been no specific event to create a sudden plunge.  In addition, there has been no significant fear of rock bottom fixed term mortgage rates going up.  This means that there is still an opportunity to get out before pricing gets worse.   For buyers who have been waiting, there continues to be a wide and increasing choice of listings waiting to choose from and the lure of falling prices. It appears that in boom markets, fear of loss has driven buyers to bid up the market very quickly and in this down market perhapes this same fear of loss has made sellers reluctant to part with property at lower prices; the result being a slower (but steady) deterioration of the market.

Remember that: “Months of Inventory” is a measure derived from the number of active listings during a given month divided by the number of sales that month. It indicates the theoretical length of time it would take to sell all of the properties on the market if nothing changed. Historically, 0-5 months of inventory has generally implied upward price pressure for the ensuing six months, 5-8 months of inventory meant a flat market with respect to pricing and over 8 months of inventory has, for the most part, precipitated downward price pressure.

Do not hesitate to call me if you have any questions and please pass this and my contact information along to any friends or family that may benifit from my services.
By Sam Wyatt - Vancouver Realtor
CLICK TO VIEW: Vancouver West Months of Inventory Sept 2010 Create Blog 

Read

The big news this month is the change in fixed interest rates – an increase of about .6 of a percent on five year fixed rates and climbing.  As a mortgage broker friend of mine commented, that will mean about an $11,000 increase in interest costs for a $400k mortgage over 5 years.  Based on recent aggregate economic data, I would also expect to see the Bank of Canada raise its rates by sometime this summer, so we can reasonably expect to see variable rates go up as well.   The key thing here is that the bigger the mortgage, the larger the total costs of borrowing the money and the more significant a change in interest rates will be on monthly payments.  For larger mortgage purchases qualifying at the new rates, this should have a real dampening effect on price increases.  The short term effect of a sharp interest rate hike is sometimes an increase in buying to capitalize on held rates so April may be a good month for sales.


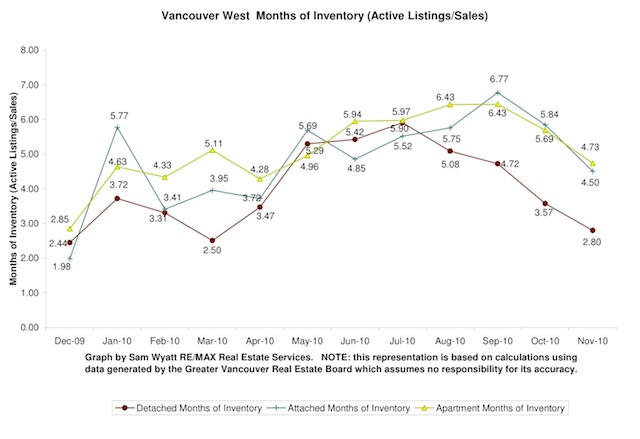
The March Months of Inventory metric for Vancouver West sits at 5.11 for apartments as new listings outpace new sales. Attached homes are at 3.95, down from January’s 5.77 but only the detached market appears to have had a substantial decrease and is now down to 2.5 months of inventory. Vancouver West average prices for apartments reached over $628k, attached homes $905k and detached homes over $1.95m. I speculate that the low inventories for detached homes are likely due the high cost of attached homes coupled with the knowledge that interest rates were set to rise. Buyers of detached homes may have opted not to purchase townhomes and half-duplexs in favour of a house. The knowledge that interest rates were set to rise likely spurred the buying on ensuring that more than 200 detached homes were sold in Vancouver West in March. I believe that the overall trend continues to point, to higher inventories and thus to lower prices over the upcoming year though I now suspect that these changes are likely to happen over the next 6 months or so, rather than immediately.  We are at near all time high pricing and I continue to advocate that if you are planning to sell in the next couple of years or are holding investment property, you should likely sell now.


Remember that: “Months of Inventory” is a measure derived from the number of active listings during a given month divided by the number of sales that month.  It indicates the theoretical length of time it would take to sell all of the properties on the market if nothing changed. Historically, 0-5 months of inventory has generally implied upward price pressure for the ensuing six months, 5-8 months of inventory meant a flat market with respect to pricing and over 8 months of inventory has, for the most part, precipitated downward price pressure.
By Vancouver Realtor - Sam Wyatt

Read

WOLF! WOLF! WOLF!
I feel a little like the boy who cried wolf.  I’ve been saying that the market is going to turn for so long that maybe now no one is listening.  Well, take a look at the Months of Inventory graph.  What you will see is that all home types have just had a significant jump in the Months of Inventory metric in January.  The change is from both substantial increases in active listings and an equally significant reduction in sales in January.  This is by far the biggest change since things got hot early last year and changes of this type generally continue in a positive feedback loop – meaning, they tend to do more of the same.  That means that I expect even more inventory to come online in February and March and I expect sales to stay lower than they have been for the past six months.  Next, take a look at the Westside Avg Prices graph. What you see is a steady increase in prices over the course of this year – with record average sale prices posted for apartments in October 2009 and for Detached and Attached homes in January 2010.  Yes, that’s right; the AVERAGE cost of a detached home on the west side of Vancouver in January 2010 was over $2,000,000.  Now, finally, take a look at the Average Price Graph from 1977 to Dec 2009.  Here we see the story of real estate; it goes up and then goes down where it lays typically for about 10 years (but as little as 3), then it goes up to a new high and falls again.  Ask yourself if the drop in 2008 followed by the fast increase in pricing in 2009 fits that trend.  No, it does not.  For anyone who is still listening:  I believe we have at best, 6 months and at worst, 2 months before prices begin to trend downwards.  I am listing my own home for sale today (I need more space anyway!).

The same old story applies; if you are planning on living happily ever after in your home for the next 10 years then you should smile and carry on.  If you are hoping to make your fortune selling your home anytime soon, it can not be soon enough.
  
Remember that: “Months of Inventory” is a measure derived from the number of active listings during a given month divided by the number of sales that month.  It indicates the theoretical length of time it would take to sell all of the properties on the market if nothing changed. Historically, 0-5 months of inventory has generally implied upward price pressure for the ensuing six months, 5-8 months of inventory meant a flat market with respect to pricing and over 8 months of inventory has, for the most part, precipitated downward price pressure.

By Sam Wyatt - Vancouver Realtor

Months Of Inventory Graph Jan 2010
Vancouver Westside Avg Prices Jan 2010
Average Prices 1977 to Dec 2009

Read

This month’s update is a no brainer:

“SELL VALENTINE!! SELLLLL!”

Many of you may remember the film “Trading Places” in which the Duke brothers (being finally duped by their unwilling experiment subjects – Eddie Murphy and Dan Aykroyd) wind up wishing they had sold their stake in frozen concentrated orange juice (FCOJ) a little earlier.  I do not want this to happen to you.

Active listing volumes are UP and Sales volumes are DOWN across the board for September.  Although the months of inventory index remains low (around 3), I expect these figures to continue to rise over the next several months and the price increases to come to an end.  I strongly feel that this is run-up in prices is a “second chance” to sell at a high point in this market cycle.

For many, the current incredibly low interest rates and the fact they have found a home they love, can afford and plan to stay in for the next 5 to 10 years means they should stay put.  The same is true for those looking for a primary residence they need but for those expecting to sell over the course of the next couple of years - I recommend selling NOW. 

For copies of the charts or tables please contact me at sam@samwyatt.com

Remember
that: “Months of Inventory” is a measure derived from the number of active listings during a given month divided by the number of sales that month.  It indicates the theoretical length of time it would take to sell all of the properties on the market if nothing changed. Historically, 0-5 months of inventory has generally implied upward price pressure for the ensuing six months, 5-8 months of inventory meant a flat market with respect to pricing and over 8 months of inventory has, for the most part, precipitated downward price pressure.

By Vancouver Realtor: Sam Wyatt

Read
Reciprocity Logo The data relating to real estate on this website comes in part from the MLS® Reciprocity program of either the Greater Vancouver REALTORS® (GVR), the Fraser Valley Real Estate Board (FVREB) or the Chilliwack and District Real Estate Board (CADREB). Real estate listings held by participating real estate firms are marked with the MLS® logo and detailed information about the listing includes the name of the listing agent. This representation is based in whole or part on data generated by either the GVR, the FVREB or the CADREB which assumes no responsibility for its accuracy. The materials contained on this page may not be reproduced without the express written consent of either the GVR, the FVREB or the CADREB.