RSS

The Months of Inventory (MOI)* for all home types has floated near 5 months for nearly 2 years now.
thumb 

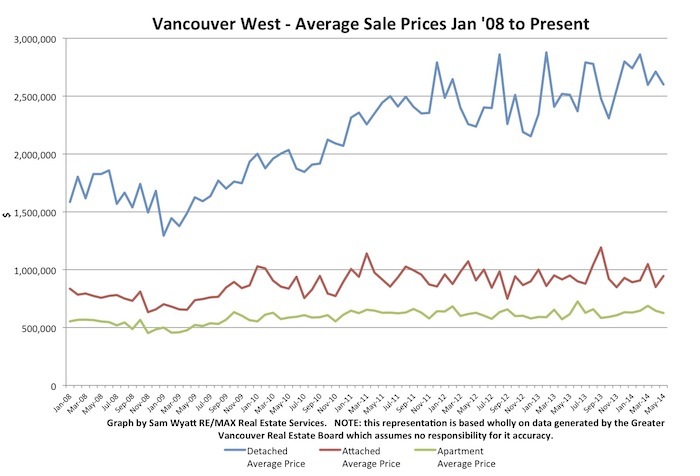
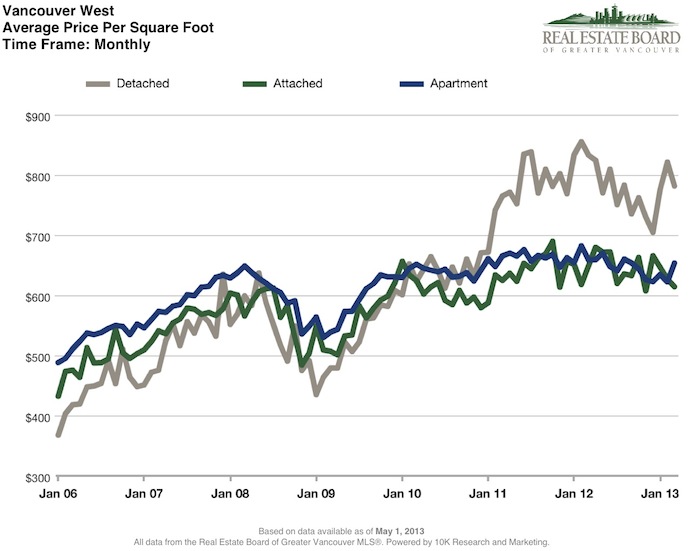
Will the current plunge in oil prices change this apparently stable market?  They may well dampen Calgary and Edmonton price increases but I believe that sharply fallen oil prices will have little to no effect on Vancouver real estate prices.  For some time now the Vancouver market has been shaped from the top.  The highest price increases have been for the most costly and scarce real estate - detached homes.  The Vancouver westside market has been driven by wealth not incomes.  Individuals with high net worth have been buying high-end homes and the increases in price have been marginal compared to their total assets.  As costly lots and homes are bought, sellers have moved to less expensive neighbourhoods or downsized thereby driving up pricing for lower cost homes all the way down the product chain to studio apartments where the smallest price changes exist.

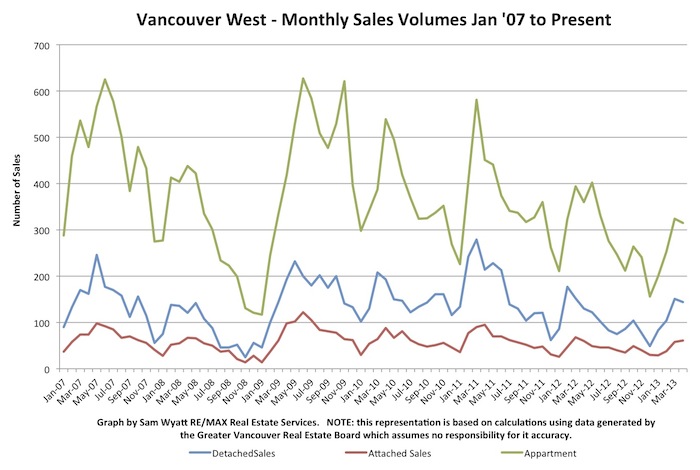
January 2013 looks to have been the turning point marking the start of the past two years of up trending sales volumes.

   thumb
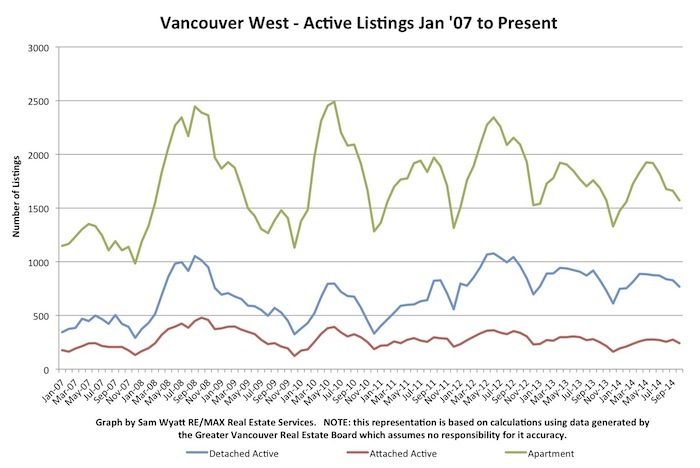
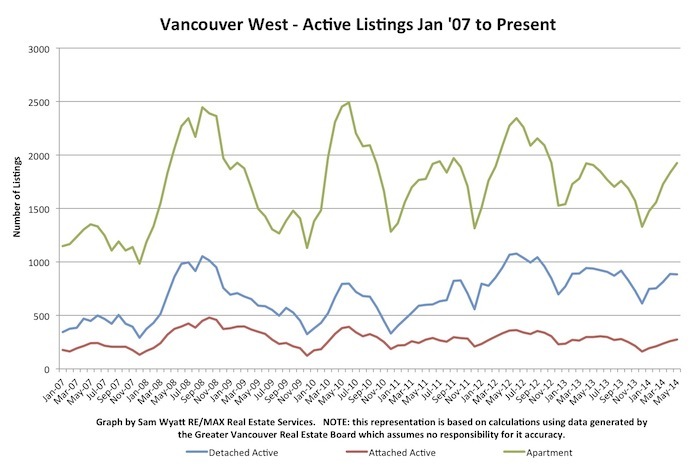
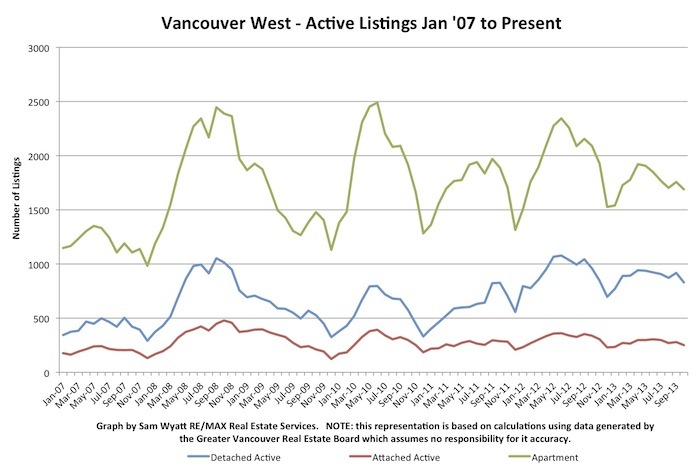
2014 has had very consistent and sustained sales volumes.  It has had the highest monthly sales volumes since the Spring of 2011.   Like sales volumes, active listings appear to have had a turning point in January of 2013.  Active listings are high relative to pre-credit crises numbers but trending lower since the start of 2013.
thumb

The US Federal Reserve Bank (Fed) ended the QE3 program about a month ago.  Thus far the bond market and the ultra low fixed mortgage rates do not seem to have been materially impacted.    The Fed introduced "quantitative easing 3" (QE3) back in the spring of last year to buy back $85 billion dollars a month of bonds and mortgage backed securities by effectively "printing" money (member banks' deposit accounts were simply increased).  There is increasing talk of rising interest rates to come in 2015. 

Pricing increases have been modest over the past year and as they have for the past few years; detached homes have been the largest "winners".

thumb

thumb

Good cash flowing real estate investments have been difficult to find in the past several years.  I continue to acquire revenue properties in Fort St. John, BC and to help clients do the same thing.  The recent announcement of the approval for the Site C Dam on the Peace River just outside Fort St. John has just bolstered an already hot investment market.
thumb
Consistent monthly income rolls in from these properties and the 30,000 plus jobs projected for the building of the new dam will only increase the need for rental properties.  Fort St. John and the Peace River District are in the heart of some of the largest natural gas deposits in North America.  Natural gas prices have fallen in the past several weeks but far less significantly than the nearly 50% plunge in oil prices.  Properties in the Peace River area are cash flowing beautifully with conservatively projected annualized returns of about 20% based on a 5-year hold.  So far, actual returns will be much better as price increases (avg. about 9%/yr since 2010) have substantially exceeded my projected 3% annual growth  due to the well deserved high demand for homes.  Do give me call and we can discuss this opportunity in more detail.

*Remember that Months of Inventory (MOI) is a measure derived from the number of active listings during a given month divided by the number of sales that month. It indicates the theoretical length of time it would take to sell all of the properties on the market if nothing changed. Historically, 0-5 months of inventory has generally implied upward price pressure for the ensuing six months, 5-8 months of inventory meant a flat market with respect to pricing and over 8 months of inventory has, for the most part, precipitated downward price pressure.

Do not hesitate to call me if you have any questions. Please pass this and my contact information along to any friends or family who might benefit from my services.

By Sam Wyatt Vancouver Realtor


Read

Months of Inventory (MOI)* continues to float near 5 months.  The MOI dropped to under 4 months for all but detached houses in October for Vancouver West Real Estate.

Chart - Inventory Jan 07 -_.jpg
In terms of sales volumes, the fall real estate market in Vancouver has been the best we've seen since 2009.  If a listing has not sold within about a month, chances are, there is an issue with the price or the presentation.
Sales Volumes.jpg
Active listing volumes have stayed persistently high relative to pre-credit-crises numbers but the continuing strong sales volumes have overcome the downward pressure this might have otherwise had on pricing.  We will see active listings volumes continue to fall as we approach December.
Active Lisitngs.jpg
The US Federal Reserve Bank (Fed) introduced "quantitative easing 3" (QE3) back in the spring of last year to buy back $85 billion dollars a month of bonds and mortgage backed securities by effectively "printing" money (member banks' deposit accounts were simply increased).  As a result, fixed rate mortgages fell to all time lows.  The Fed has just ended the QE3 program but thus far the bond market and mortgage rates do not seem to have been impacted.  
HPI Index.jpg

Prices have remained high and have trended upwards over the course of 2014 thus far.  Buying Investment property in Vancouver continues, in my opinion, to be a gamble but the purchase of a primary residence is still a good option for many people.  With strong sales volumes and pricing, it is a great market for selling real estate.

On the investment front, I continue to acquire revenue properties in Fort St. John, BC and to help clients do the same thing.  When I see my consistant monthly income roll in from these properties, I am grateful that these funds are not in highly volatile stock markets.  Fort St. John and the Peace River District are in the heart of some of the largest natural gas deposits in North America.  Premier Christy Clark's election promise to promote BC's natural gas industry likely won her the last election.  Properties in the Peace River area are cash flowing beautifully with projected annualized returns of about 20% based on a 5-year hold.  If you haven't yet contacted me and are interested in exploring this opportunity, please give me a call. 

*Remember that Months of Inventory (MOI) is a measure derived from the number of active listings during a given month divided by the number of sales that month. It indicates the theoretical length of time it would take to sell all of the properties on the market if nothing changed. Historically, 0-5 months of inventory has generally implied upward price pressure for the ensuing six months, 5-8 months of inventory meant a flat market with respect to pricing and over 8 months of inventory has, for the most part, precipitated downward price pressure.

Do not hesitate to call me if you have any questions. Please pass this and my contact information along to any friends or family who might benefit from my services.

- By Sam Wyatt Vancouver Realtor

Read

Months of Inventory (MOI) has consistently hovered above and below the 5 months of inventory level since early 2013.  The low MOI for all product types has indicated a continuing strong demand for Vancouver West Real Estate.Chart - Inventory Jan 07 -_.jpg

In December of 2012 MOI for detached homes hit over 14 months after a steady rise.  It looked like the Vancouver market was experiencing the beginnings of a downturn.   So what happened in early 2013?  In the spring of 2013 many lenders were offering a fixed 5 yr. mortgage rate of 2.69%.  Rates fell, in large part, because in late 2012 the US Federal Reserve Bank (Fed) introduced "quantitative easing 3" (QE3).  The Fed began to buy back $85 billion dollars a month of bonds and mortgage backed securities by effectively "printing" money (member banks deposit accounts were simply increased).  This massive input into the bond market drove up bond prices and drove yields down.  In turn, fixed rate mortgages fell to all time lows.  Rates crept up again starting the fall 2013 after the Fed suggested it might end or reduce the program.  Ultimately they opted to begin to taper by $10 billion a month.  5 yr. fixed mortgage rates came down again in the spring of 2014 but this time to only about 2.99% where they sit now.  I believe that it is no small detail that QE3 is scheduled to end in October/November of this year.  What happens when the stimulus money is removed completely is uncertain and it is probably uncertainty that is most dangerous for markets. 


Sales Volumes.jpg

Sales volumes also have had a climbing trend since early 2013.  They, like the MOI, reversed a 4 year movement between 2009-2012.   Active listing volumes have stayed persistently high relative to pre-credit-crises numbers but the continuing strong sales volumes have overcome the downward pressure this might have otherwise had on pricing.

Active Lisitngs.jpg
With the benefit of hindsight, the HPI price index suggests that January 2013 was a great time to buy a detached home. The HPI price jumped from $2,000,000 to close to $2,300,000 in less than 2 years!  At the time it looked more like things might just carry on downwards
.


HPI Index - Detached.jpg
The graph for apartments looks dramatic and volatile but its scale is much more modest than for detached homes.  The small lift between January 2013 and September 2014 has not been great for flippers of new condominium developments who have only been counting on capital appreciation for their returns while often subsidising a tenant's rent in a negative cash flow position.

HPI Index - Apartments.jpg

Attached homes saw a lift closer to houses between January 2013 and September 2014.


HPI Index - Townhomes.jpg

The short answer to how Vancouver Real Estate is doing at the moment is: "very well thank you" with some caveats for condo flippers.  It will also be very interesting to see how the end of stimulus from the Fed will influence mortgage rates and sales as we move forward. 

On the investment front, I continue to acquire revenue properties in Fort St. John, BC and to help clients do the same.  Fort St. John and the Peace River District are in the heart of some of the largest natural gas deposits in North America.  Premier Christy Clark's election promise to promote BC's natural gas industry likely won her the last election.  Properties in the Peace River area are cash flowing beautifully with projected annualized returns of about 20% based on a 5-year hold.  Many of you have a already contacted me and bought property.  If you haven't yet and are interested in exploring this opportunity, please give me a call.

Remember that Months of Inventory (MOI) is a measure derived from the number of active listings during a given month divided by the number of sales that month. It indicates the theoretical length of time it would take to sell all of the properties on the market if nothing changed. Historically, 0-5 months of inventory has generally implied upward price pressure for the ensuing six months, 5-8 months of inventory meant a flat market with respect to pricing and over 8 months of inventory has, for the most part, precipitated downward price pressure.

Do not hesitate to call me if you have any questions. Please pass this and my contact information along to any friends or family who might benefit from my services.

By Sam Wyatt Vancouver Realtor

Read

Months of Inventory (MOI) for Vancouver West real estate was under five months for all home types in May.
Chart - Inventory Jan 07 -_.jpg
Sales volumes have been brisk for detached Westside homes.  Over 200 detached homes were sold on the Westside of Vancouver in May!  We have not had over 200 houses sold in a single month since spring of 2011.  Apartments and townhomes did not fare as well, neither of which came close to their spring 2011 volumes.

Sales Volumes.jpg
Annual peak and trough active listing volumes appear that they will decline in 2014.  It is this relative decline in active listings that has had the greatest effect on the lower MOI and the tight market we find ourselves in.

Active Lisitngs.jpg
The other magnifying factor this spring has been a return to sub 3% five year fixed interest rates.   As always, low cost money makes it mentally easier for buyers to raise their price ranges.  Vancouver continues to be one of the nicest cities to live in on the planet and our home prices certainly reflect that!
Chart - Avg Prices - Jan '08 -_.jpg

I sold my Vancouver real estate holdings in 2010 expecting to see a downturn in prices. For houses, sales prices have risen significantly since that time.  For apartments there has been a much more modest rise.  In hindsight I would be happy to have held several detached homes over the period but then as now, my choice was guided by numbers and statistical probability.  Since 2010 I moved my real estate cash into investments in the Peace River region of BC. 

Are you are an investor and want to buy cash flowing properties with minimal down payments?   There is precious little opportunity in Vancouver were only the gamble of capital gains are sought.  I have purchased several revenue properties in Fort St. John, BC and continue to help clients do the same.  Fort St. John and the Peace River District are in the heart of some of the largest natural gas deposits in North America.  Premier Christy Clark's election promise to promote BC's natural gas industry won her the last election.  Properties in the Peace River area are cash flowing beautifully with projected annualized returns of about 20% based on a 5 year hold.  If you are interested in exploring these investment opportunities, give me a call and we can get started.

Remember that Months of Inventory (MOI) is a measure derived from the number of active listings during a given month divided by the number of sales that month. It indicates the theoretical length of time it would take to sell all of the properties on the market if nothing changed. Historically, 0-5 months of inventory has generally implied upward price pressure for the ensuing six months, 5-8 months of inventory meant a flat market with respect to pricing and over 8 months of inventory has, for the most part, precipitated downward price pressure.

Do not hesitate to call me if you have any questions. Please pass this and my contact information along to any friends or family who might benefit from my services.

Sam Wyatt VancouverRealtor


Read

Months of Inventory (MOI) for Vancouver West real estate continued to hover around five months for all home types in March and April.  Apartments were the lowest, at only 3.98 months!
Chart - Inventory Jan 07 -_.jpg

It has been a busy spring market with both a rise in active listings and sales volumes.  Anecdotally, my last two listings sold within a few days.  One sold for over asking in a multiple offer and the other for full price.  By all measures the Vancouver Real Estate market is busy.


Active Lisitngs.jpg
The brisk market is part of the typical cycle in which the spring market has an increase in both active listings and sales volumes.  In spite of a hot market, sales volumes are no where near the highs of 2009-2011. 

Sales Volumes.jpg

One of the magnifying factors has been a return to sub 3% five year fixed interest rates.  Interest rates dropped to 2.69% for a five year fixed rate last spring (2013) and jumped back up to about 3.5% last summer after the US Federal Reserve (Fed) chairman announced that they would stop their expansion of the money supply through bond buybacks.  The sharp change in the bond market that followed persuaded the Fed not to discontinue the bond buying program but rather to taper the $85 billion a month program by $10 billion a month. The Fed has continued to reduce its monthly money "printing" or "quantitative easing" down to $45 billion for May.  They expect to wind the program down by October this year.   One of the effects of this stimulus has been to suppress interest rates.  It will be interesting to see how high interest rates may rise once the taps are fully closed later this year.


Chart - Avg Prices - Jan '08 -_.jpg

Since the startling rise of detached home prices between 2009 and 2011, average sale prices for westside houses have trended along the $2.5m mark.  Apartments and attached homes have been relatively stable since then as well.  In summary, the spring market is quite active but not nearly what it was in 2010 & 2011.

If you are an investor and want to buy cash flowing properties with minimal down payments there is precious little of interest in Vancouver.  I have purchased several revenue properties in Fort St. John, BC and continue to help clients do the same.  Fort St. John and the Peace River District are in the heart of one of the largest natural gas deposits in North America.  You may recall Premier Christy Clark's election promise to promote BC's natural gas industry - it won her the election.  Properties in Fort St. John are cash flowing beautifully with projected annualized returns of about 20% based on a 5 year hold.  If you are interested in exploring these investment opportunities, give me a call and we can get started.

Remember that Months of Inventory (MOI) is a measure derived from the number of active listings during a given month divided by the number of sales that month. It indicates the theoretical length of time it would take to sell all of the properties on the market if nothing changed. Historically, 0-5 months of inventory has generally implied upward price pressure for the ensuing six months, 5-8 months of inventory meant a flat market with respect to pricing and over 8 months of inventory has, for the most part, precipitated downward price pressure.

Do not hesitate to call me if you have any questions. Please pass this and my contact information along to any friends or family who might benefit from my services.

By Sam Wyatt VancouverRealtor

Read

Months of Inventory (MOI) for Vancouver West real estate dropped below 5 months for all home types in February.
Chart - Inventory Jan 07 -_.jpg

December, January and February have all been good months for Vancouver Westside sales.  These winter months are generally times when active listing volumes are at their annual low points.  The result has been a tight market for the start of 2014.  Will it continue?

The dominant news in real estate over the last couple of weeks has been the Federal Government's elimination of the "investor" immigration program.  Part of that announcement included the elimination of about 65,000 backlogged applications in process.  The question people are asking is: will this affect real estate prices in Vancouver?  The simple answer is yes.  If nothing else, foreign nationals who have purchased homes in anticipation of their applications being processed may rethink their plans and sell their property.  In addition, new prospective foreign buyers will be scared off by the lack of an easy avenue to immigrate by.  Sales of new condominiums at UBC (a hot bed of Chinese foreign buyers) have already fallen off.  The more detailed answer is that in the longer run it may not change much.  We are still waiting to find out if the Federal Government will refuse to allow provinces to use their Provincial Nominee Programs to bring in "investors" in.  For now, the provinces have reached their quotas and we will have to wait to see what the Federal Government is willing to allow going forward.  I believe that it is likely that we will ultimately see some sort of investor program resurface via the Provincial Nominee Programs.  Remember also that many of the so called "investors" have been very wealthy and buying up Westside detached homes.  Between January 2009 and January 2012, the average sale price of a Westside detached home went from a little less than $1.3m to nearly $2.5m.  Contrast that to the much smaller change in condo prices. In January 2009 average sale price of a Westside condo went from about $450k to $640k in January 2012. 

Chart - Avg Prices - Jan '08 -_.jpg

If you bore into individual sales you find that the highest priced real estate went way up while the lowest priced real estate barely moved.  The addition of all that foreign capital in the high end of the market didn't have much of an effect on the bottom of the price ladder.  The removal of that inflow of money will likely have a disporportionate effect on higher priced detached homes than on lower cost condos.

Interest rates may be another coming factor.   Many believe that the Federal Reserve (Fed) will continue to taper its monthly money "printing" or "quantitative easing" to $55 billion at its upcoming March 18-19th meeting.  It had been buying $85b in bonds monthly since the spring of 2013 until December 2013 when they began the tapering plan.  The Federal Reserve intends to continue to reduce its purchases by 10 billion a month until late this year when the program is supposed to come to an end.  One of the effects of this stimulus is to suppress interest rates.  It will be interesting to see how high interest rates will rise as the taps are slowly closed.  I anticipate that we will see 5yr fixed mortgage rates go up another 1%.

So what does it mean to me?  The questions I get asked most are: "Is it the right time to sell?" and  "Is it the right time to buy?".  The answer is yes but the questions should be  "Is it the right time for ME" and "where is it a good time to buy/sell?"

I sold all of my Vancouver real estate holdings and presently rent.  The reason is simple - it costs a lot less!  The Canadian Housing and Mortgage Corporation recently released its 2013 Rental Market Report and it illustrates that very point - it is significantly less costly to rent than purchase a home on the westside of Vancouver.  Don't get me wrong, there are plenty of reasons why buying a home in Vancouver makes more sense then renting but for now, the cost is not one of them. The most important thing to remember is that the longer you plan to hold your property the more likely it will pay off.

If you are an investor and want to buy cash flowing properties with minimal down payments then the question about where to buy is far more significant.  The answer is:  go where things are growing.  I have purchased several revenue properties in Fort St. John BC and have and continue to help clients do the same.  Fort St. John is in the heart of one of the largest natural gas deposits in North America.  You may recall Premier Christy Clark's election promise to promote BC's natural gas industry - it won her the election.  Properties in Fort St. John are cash flowing beautifully with projected annualized returns of about 20% based on a 5 year hold.  If you are interested in exploring the investment opportunities in Fort Saint John, give me a call and we can get started.

Remember that Months of Inventory (MOI) is a measure derived from the number of active listings during a given month divided by the number of sales that month. It indicates the theoretical length of time it would take to sell all of the properties on the market if nothing changed. Historically, 0-5 months of inventory has generally implied upward price pressure for the ensuing six months, 5-8 months of inventory meant a flat market with respect to pricing and over 8 months of inventory has, for the most part, precipitated downward price pressure.

Do not hesitate to call me if you have any questions and please pass this and my contact information along to any friends or family who might benefit from my services.

By Sam Wyatt VancouverRealtor

Read

Months of Inventory (MOI) for Vancouver West real estate remained near 5 months for all home types in December.

Chart - Inventory Jan 07 -_.jpg

The months of inventory metric hit over 14 months in December of 2012 but steadily dropped to around 5 months over the course of 2013 where it is now hovering.  I suspect that the Vancouver real estate market will remain stable as long as the US Federal Reserve Bank continues to purchase billions of dollars a month in bonds.  This stimulus is effectively increasing the money supply and depressing interest rates lower from where they would otherwise be.  Interestingly, the Federal Reserve has already reduced its bond buying to $75,000,000,000 in December from $85,000,000,000 the month before.  It plans to continue to reduce its purchases by 10 billion a month until late this year when the program will come to an end.  It will be interesting to see how high interest rates will rise as the taps are slowly closed. I am guessing we will see 5yr fixed rates go up another 1%.

Pricing on detached westside homes in January of 2013 was $1,995,300, the lowest it has been since early spring of 2011.  Thanks to the spring market, prices grew slightly and the HPI index for westside houses was $2,103,300 in December 2013.  Pricing has generally been stable for attached homes and apartments in 2013.

14-HPI Index Detached-Jan.jpg

So what does it mean to me?  The questions I get asked most are: "Is it the right time to sell?" and  "Is it the right time to buy?".  The answer is yes but the questions should be  "Is it the right time for ME" and "where is it a good time to buy/sell?"

I sold all of my Vancouver real estate holdings and presently rent.  The reason is simple - it costs a lot less!  The Canadian Housing and Mortgage Corporation recently released its 2013 Rental Market Report and it illustrates that very point - it is significantly less costly to rent than purchase a home on the westside of Vancouver.  Don't get me wrong, there are plenty of reasons why buying a home in Vancouver makes more sense then renting but for now, the cost is not one of them. The most important thing to remember is that the longer you plan to hold your property the more likely it will pay off.

If you are an investor and want to buy cash flowing properties with minimal down payments then the question about where to buy is far more significant.  The answer is:  go where things are growing.  I have purchased several revenue properties in Fort St. John BC and have and continue to help clients do the same.  Fort St. John is in the heart of one of the largest natural gas deposits in North America.  You may recall Premier Christy Clark's election promise to promote BC's natural gas industry - it won her the election.  Properties in Fort St. John are cash flowing beautifully with projected annualized returns of about 20% based on a 5 year hold.  If you are interested in exploring the investment opportunities in Fort Saint John, give me a call and we can get started.

Remember that Months of Inventory (MOI) is a measure derived from the number of active listings during a given month divided by the number of sales that month. It indicates the theoretical length of time it would take to sell all of the properties on the market if nothing changed. Historically, 0-5 months of inventory has generally implied upward price pressure for the ensuing six months, 5-8 months of inventory meant a flat market with respect to pricing and over 8 months of inventory has, for the most part, precipitated downward price pressure.

Do not hesitate to call me if you have any questions and please pass this and my contact information along to any friends or family who might benefit from my services.

By Sam Wyatt VancouverRealtor

Read

In October the Months of Inventory (MOI) for Vancouver real estate was under 5 months for all home types.  This is a stunning reversal of where things were this time last year.

Chart - Inventory Jan 07 -_.jpg

When months of inventory hit over 14 months last December it appeared like the spring market might not come at all but the super-low fixed rates that emerged in early spring helped to spark a resurgence of buying.  Will the buying continue now that fixed rates are higher?  Will we see more changes in fixed term rates?  The US Federal Reserve Bank  (Fed) has continued to purchase about $85 billion dollars a month of bonds, effectively increasing the money supply and depressing interest rates from what they would otherwise be.  The increase in rates this fall was as a direct result of the Federal Reserve Bank informing the public that they were going to begin scaling the purchasing back.  After the sharp response in the bond market the Fed decided to continue its purchasing at the same rate - for now.  The sheer scale of the monetary input from the Fed and other global central banks will definitely be a factor in interest rates and thus mortgage rates and the real estate.  The Bank of Canada has made clear that it intends to keep short term lending rates low for some time to come.

Vancouver West sales volumes this September and October were amongst the best in years.  I suspect that ultra low fixed 5 year term mortgage rates of 2.79% that finally expired in the middle of October were, in large part, responsible.  With equivalent rates now at around 3.69% there was a huge incentive to buy before the lower rates expired.  

Sales Volumes.jpg

In spite of a great fall, the spring market this year was far from exceptional.  When looking at the chart above, it appears that the robust fall market is unlikely to put much of a dent in the long-term trend downward in sales volumes.

Active listings since the 2008 credit crisis have been significantly higher and trending higher than prior to the crisis.  However, this past spring volumes neither broke through 2000 active listings for apartments nor 1000 listings for detached homes.  Are current active listing volumes levelling off to create a new norm? 

Active Lisitngs.jpg

Pricing on detached westside homes in January was the lowest it has been since early spring of 2011 but thanks to the spring market, prices grew slightly.  The HPI index has westside homes at $2,089,700 in September.  Pricing has generally been stable for attached homes and apartments so far this year.HPI Index.jpg

Remember that Months of Inventory (MOI) is a measure derived from the number of active listings during a given month divided by the number of sales that month. It indicates the theoretical length of time it would take to sell all of the properties on the market if nothing changed. Historically, 0-5 months of inventory has generally implied upward price pressure for the ensuing six months, 5-8 months of inventory meant a flat market with respect to pricing and over 8 months of inventory has, for the most part, precipitated downward price pressure.

Do not hesitate to call me if you have any questions and please pass this and my contact information along to any friends or family who might benefit from my services

By Sam Wyatt VancouverRealtor 

Read

Typical discounted fixed 5 year term mortgage rates have jumped about 1% in the past two months from 2.79% to 3.69%.  We have had much better sales volumes this spring and summer than I had anticipated so the effect of the continuing rise in rates will be interesting to watch.   The best variable rates are at about 2.6% and many people are choosing to take variable rates as the spread between fixed and variable rates grows.  This may well put those with variable mortgages in a tight position in the coming years when those rates inevitably rise. 

Chart - Inventory Jan 07 -_.jpg

In July, Months of Inventory (MOI) for Vancouver real estate rose again to 6.98 months and inched down to 6.56 for detached homes.  It rose progressively to 5.14 in July and 5.74 in August  for attached homes. Apartments fell to 4.60 in July but jumped to over 5 months in August.  The MOI this year to date has stayed generally within the so called "balanced" market spectrum between about 5 and 8 months of inventory.  The trend from January until now has been a steady reduction in the MOI from of December when detached homes' MOI was over 14 months.  However, the long term trends in both sales volumes and active listing volumes since spring of 2011 continue to suggest to me that we will see the MOI rise to a new peak in December or January. 

Sales Volumes.jpg

Sales volumes peaked in May but they did not drop off as precipitately in July and August as they often have.  I attribute the strong sales volumes in July and August to the interest rate increases that happened between June and August.   Buyers with held interest rates as low as 2.79% are eager to spend the banks' money before their rates expire in September.

Active Lisitngs.jpg

Active listings volumes peaked in April (June for Attached homes). Typically we will see a little increase in listings in September. The low points for active listing volumes have been moving progressively higher since the credit crisis in 2008 and it seems unlikely that we will see a dramatic reversal in this trend.     

HPI Index.jpg

Pricing through the summer was pretty stable due to the good sales activity.  MOI numbers remained close to the balanced market spectrum in which prices generally remain static.   

In spite of good volumes of sales this summer, I expect to see downward price pressure to resume - particularly on detached homes.

Remember that Months of Inventory (MOI) is a measure derived from the number of active listings during a given month divided by the number of sales that month. It indicates the theoretical length of time it would take to sell all of the properties on the market if nothing changed. Historically, 0-5 months of inventory has generally implied upward price pressure for the ensuing six months, 5-8 months of inventory meant a flat market with respect to pricing and over 8 months of inventory has, for the most part, precipitated downward price pressure.

Do not hesitate to call me if you have any questions and please pass this and my contact information along to any friends or family who might benefit from my services.

BY SAM WYATT - VANCOUVER REALTOR


Read

The big news in the last couple of weeks has been the sudden rise in fixed mortgage rates.  So far the effect has not been felt.  In June, Months of Inventory (MOI) rose to 6.37 months for Vancouver detached homes.  It also slightly rose to 4.84 for attached homes and fell to 4.79 for apartments.

The MOI this past spring stayed close to the so called "balanced" market spectrum between 5 and 8 months of inventory.  The trends in both sales volumes and active listing volumes suggest that we will see the MOI rise during the later half of this year.

Sales volumes were good this spring but certainly nothing like those of 2007, 2009, 2010 or 2011.  The Canada Day long weekend definitely felt like the end of the spring market; it was the first weekend since February that I have been able to get some weekend time with my family!
Five year fixed term rates went from the lowest typical discounted rate of 2.79% up to 3.19% and most folks are getting rates of 3.39%!  Especially for large mortgages ($1m+), this change, though small, will ultimately have a chilling effect on the market.  The sense of volatility that it creates may move more people into the 10 year rates which can still be had at 3.99%.  The result is higher costs of ownership.  I continue to anticipate lower sales volumes going forward for 2013. 

Unlike sales volumes, active listings often don't peak until late summer or fall.  The low points for active listing volumes have been moving progressively higher since the credit crisis in 2008 and it seems unlikely that we will see a dramatic reversal in this trend.   

Pricing through June was stable for detached homes and attached homes.  MOI numbers rose in June but stayed close to the balanced market spectrum in which prices are generally stable.   

The MOI is reminiscent of last year's buoyant spring market which was followed by a very slow rest of the year and falling prices.  In spite of good volumes of sales in June, I would caution against thinking that prices might start upward in earnest.  Falling prices is the trend and I expect it to continue - particularly on detached homes.

SELLERSDO NOT HESITATE TO CALL ME FOR A PROPERTY EVALUATION.  Time has run out on the spring market.

BUYERS:  Active listing volumes have stayed high and if you have and interest rate held, it is a nice time to be shopping for a home.  BE SURE TO TALK TO YOUR MORTGAGE BROKER TO HOLD A RATE AS VOLATILITY SHOULD BE EXPECTED MOVING FORWARD.  Please call me if you would like a referal to a good broker.

Remember that Months of Inventory (MOI) is a measure derived from the number of active listings during a given month divided by the number of sales that month. It indicates the theoretical length of time it would take to sell all of the properties on the market if nothing changed. Historically, 0-5 months of inventory has generally implied upward price pressure for the ensuing six months, 5-8 months of inventory meant a flat market with respect to pricing and over 8 months of inventory has, for the most part, precipitated downward price pressure.

Do not hesitate to call me if you have any questions and please pass this and my contact information along to any friends or family who might benefit from my services.

By Sam Wyatt VancouverRealtor

Read

Months of Inventory (MOI) fell to 5 months for Vancouver detached homes.  It remained at, and fell to under 5 months for attached homes and apartments respectively.Chart - Inventory Jan 07 -_.jpg
Vancouver real estate is now back to the MOI levels of last spring.  As a Vancouver Realtor, I was pleasantly surprised that May was a such a good month for sales volumes for both my clients and the Vancouver market.  Those sales volumes are what helped drive down the MOI in spite of high volumes of active listings.Sales Volumes.jpg
Sales volumes generally peak in the Spring so it is likely that May will be the high point for the year (though I said that about March).  May's real estate sales are comparable to May of last year but the trend to lower volumes of sales remains apparent.Active Lisitngs.jpg

Unlike sales volumes, active listings don't typically peak until mid summer so It will be very interesting to see whether sales remain strong and listing volumes drop over the next few months.  I will be surprised if either is the case.

HPI Index.jpg

Pricing through May was stable and even edged up incrementally for detached homes.  If MOI numbers remain where they are now we should see the fall in prices from last year stabilize.  More likely, the trend of low sales volumes and high active listings will continue and prices will begin to fall again this summer.  

The MOI is reminiscent of last year's buoyant spring market which was followed by a very slow rest of the year and falling prices.  In spite of good volumes of sales in May, I would caution against thinking that prices might start upward in earnest.  Falling prices is the trend and I expect it to continue - particularly on detached homes.

SELLERSDO NOT HESITATE TO CALL ME FOR A PROPERTY EVALUATION.  Sell will things are moving.

BUYERS:  Active listing volumes have stayed high and with the great interest rates available, it is a nice time to be shopping for a home.

I am presently selling ALDER CROSSING and THE WESTERLY two boutique developments in Fairview Slopes and West Kitsilano respectively.  Pricing is sharp.  At Alder Crossing Investor's Studio apartments start at $239,900 and two bedroom and den townhomes with 250 sq.ft. roof decks are priced at $769,900.  WE WILL BE OPENING A DISPLAY SUITES FOR ALDER CROSSING VERY SOON.  At The Westerly one bedrooms start at $319,900 and 2 bedrooms start at $469,900.  The best part is that HST does NOT apply.

Remember that Months of Inventory (MOI) is a measure derived from the number of active listings during a given month divided by the number of sales that month. It indicates the theoretical length of time it would take to sell all of the properties on the market if nothing changed. Historically, 0-5 months of inventory has generally implied upward price pressure for the ensuing six months, 5-8 months of inventory meant a flat market with respect to pricing and over 8 months of inventory has, for the most part, precipitated downward price pressure.

Do not hesitate to call me if you have any questions and please pass this and my contact information along to any friends or family who might benefit from my services.

SAM WYATT VANCOUVERREALTOR

Read

The huge rise in prices for detached houses on Vancouver's Westside from 2009 to 2012 created the largest premium in price per square foot for houses relative to other home types in recent history. 

13-Price Per Square Foot-Mar.jpg

If you're living in a detached Westside house there has never been a better time to downsize.  Even if you don't want to "downsize" you could be living in exactly the same square footage as your detached home but pay more than 100/sq.ft. less for the space.  It means that you'll be less exposed to falling home prices.  For many it also means that they will be trading in an old "character" house with all its plumbing and electrical concerns for a newer modern home.  Talk about win-win.  

Timing will be important though.  Westside Months of Inventory (MOI) turned upwards in April, likely signaling the crest for sales volumes this spring.  If the MOI follows the pattern of 2012, then we will see it rise again to a new high point late in the year.  Last year the MOI figures bounced up to high points not seen since the credit crisis - to over 14 months for detached homes.  Attached homes enjoyed the lowest MOI in April at 4.89 months while Detached and Apartments weere both back over 6 months.


Chart - Inventory Jan 07 -_.jpg

A rising MOI will likely mean that May will be the last really good month this year to sell a home so list the house now and look for the 1/2 duplex, tomehome or apartment once you've got a firm offer.  If MOI numbers do increase like last year then prices are almost certain to continue their decline and the hardest hit will continue to be detached homes

HPI Index.jpg


MOI was up in April due to a decline in sales volumes and an increase in active listings.  In itself this is not worrying but rather a seasonal reality.  The trouble is that if March's 324 Westside house sales are the high point for the year, then they will represent a 20% decline compared to 2012's 402 sales and nearly a 50% decline compared to 2009's 627 sales.  The trend since the run-up after the credit crisis has been declining sales volumes in which both the high and low seasons (Spring and Winter) have generally seen progressively fewer sales each year. 

 Sales Volumes.jpg

Inversely to sales volumes, active listings' low and high points have been, for the most part, increasing progressively each year.
Active Lisitngs.jpg

Active listings have stayed stubbornly high, particularly for detached homes which sat at 943 on April 30th.  The active listings low points in 2012 were the highest ever for annual low points for all home categories.  It now seems inevitable that active listings will crack 1000 detached homes again this year. 

The increasing MOI is reminiscent of last year's buoyant spring market which was followed by a very slow rest of the year and falling prices.  Unfortunately, 2013 looks, for now, like it will continue the trend.  Continue to expect prices to fall - particularly on detached homes.

SELLERS:  There has not been such a great opportunity to downsize in recent history.  DO NOT HESITATE TO CALL ME FOR A PROPERTY EVALUATION.

BUYERS:  Active listing volumes have stayed high and are starting to rise again.  with the great interest rates available, it is a nice time to be shopping for a home.

I am presently selling ALDER CROSSING and THE WESTERLY two boutique developments in Fairview Slopes and West Kitsilano respectively.  Pricing is sharp.  At Alder Crossing Investor's Studio apartments start at $239,900 and two bedroom and den townhomes with 250 sq.ft. roof decks are priced at $769,900.  At The Westerly one bedrooms start at $319,900 and 2 bedrooms start at $469,900.  The best part is that HST does NOT apply.  THE WESTERLY display suite is closing May 6th to start construction so don't delay in coming in to see it.

Remember that Months of Inventory (MOI) is a measure derived from the number of active listings during a given month divided by the number of sales that month. It indicates the theoretical length of time it would take to sell all of the properties on the market if nothing changed. Historically, 0-5 months of inventory has generally implied upward price pressure for the ensuing six months, 5-8 months of inventory meant a flat market with respect to pricing and over 8 months of inventory has, for the most part, precipitated downward price pressure.

Do not hesitate to call me if you have any questions and please pass this and my contact information along to any friends or family who might benefit from my services.

SAM WYATT VANCOUVER REALTOR

Read
Reciprocity Logo The data relating to real estate on this website comes in part from the MLS® Reciprocity program of either the Greater Vancouver REALTORS® (GVR), the Fraser Valley Real Estate Board (FVREB) or the Chilliwack and District Real Estate Board (CADREB). Real estate listings held by participating real estate firms are marked with the MLS® logo and detailed information about the listing includes the name of the listing agent. This representation is based in whole or part on data generated by either the GVR, the FVREB or the CADREB which assumes no responsibility for its accuracy. The materials contained on this page may not be reproduced without the express written consent of either the GVR, the FVREB or the CADREB.